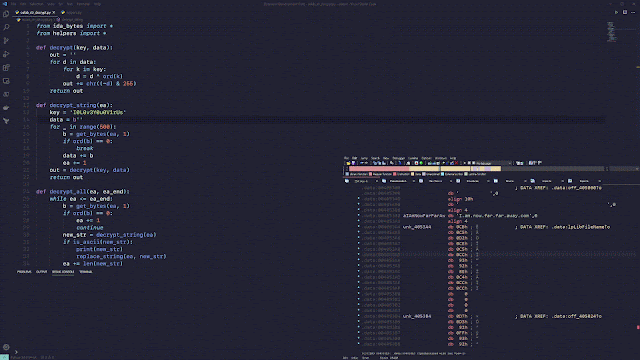
IDACode makes it easy to execute and debug Python scripts in your IDA environment without leaving Visual Studio Code. The VS Code extension can be found on the marketplace.
IDACode is still in a very early state and bugs are to be expected. Please open a new issue if you encounter any issues.
Features
Speed: Quickly create and execute scripts. Debugging: Attach a Python debugger at any time. Compatibility: IDACode does not require you to modify your scripts in a specific way. All scripts can be executed from within IDA without changes. Modularity: IDACode does not make extensive use of safe wrappers for thread synchronization, this allows you to import any module from any path at any given time. Instead IDACode synchronizes the script execution thread with IDAs main thread to avoid performance and unexpected issues. Syncing: As IDACode uses debugpy for communication, it syncs the output window naturally with VS Code's output panel.IDACode supports both Python 2 and Python 3!
Setup
To set up the dependencies for the IDA plugin run:
# IDACode supports the latest debugpy as of version 3.0.0, make sure to upgrade!
python -m pip install --user debugpy tornado
Either clone this repository or download a release package from here. ida.zip reflects the contents of the ida folder in this repository. Copy all files into IDAs plugin directory.
The next step is to configure your settings to match your environment. Edit idacode_utils/settings.py accordingly:
HOST: This is the host address. This is always 127.0.0.1 unless you want it to be accessible from a remote location. Keep in mind that this plugin does not make use of authentication. PORT: This is the port you want IDA to listen to. This is used for websocket communication between IDA and VS Code. DEBUG_PORT: This is the port you want to listen on for incoming debug sessions. PYTHON: This is the absolute path to the Python distribution that your IDA setup uses. LOGGING: Determines whether the debugger should log into files. This is especially useful when you are running into issues with IDACode. Please submit a new issue if you find anything. The files are always located in your temp directory (e.g. Windows: %TEMP%). The files are called debugpy.*.log.You can now start the plugin by clicking on IDACode in the plugins menu.
The VS Code extension is available on the marketplace. To configure the extension please refer to the extension's README.
Usage
IDA
Hit IDACode in the plugin menu. You should be greeted with the following text:
VS Code
As of version 0.2.0 IDACode supports "Execute on save" which is enabled by default. VS Code will automatically execute your script in IDA as soon as you save the current document (for example with CTRL+S). This behavior can be disabled in the settings.
There are 4 commands at your disposal:
Once you have a folder open that you want to put your scripts in you are ready to connect to IDA. You can do so by either executing Connect to IDA or Connect and attach a debugger to IDA. Please keep in mind that a debug session is permanent until you restart IDA. You can not change the workspace folder once the debugger has started.
Ensure that the workspace folder is the folder that your main scripts are located in.
Once you are connected you are able to select Execute script in IDA.
Debugging
IDACode uses VS Code's remote debugger to connect to IDA. All VS Code features are supported. However, you have to specify the scripts entrypoint by using Python builtin functionality: breakpoint. This instruction tells the debugger to pause execution, if there's no debugger present it will just ignore the function. IDACode imports a helper package called dbg which implements an overload of breakpoint called bp. This function supports logging and conditionals:
dbg.bp(name==".text", f"found {name} at {segment}")
Please also note that a breakpoint() call should never occur at the end of a file, it must always be before any other line of code as it breaks on the next instruction in your code. Also note that if you decide to use the dbg package you must either remove all references or use the variable __idacode__ as conditional before executing it as a normal IDA script.
It is also important that attaching a debugger will create a new debugger instance. In most cases this is not what you want. If you disconnect from the debugger use VS Code's remote debugger to connect back.
.png)
 3 years ago
187


 Bengali (Bangladesh) ·
  English (United States) ·